Showing posts with label articulation. Show all posts

Thursday, May 9, 2019

Student Placement with a Google Sheet and STAR


I’ve been steadily making improvements to my Student Placement system and thought others might find it useful. It is a juiced up Google Sheet that integrates with the STAR RTI screener. We have been using it for years and the time spent on student placement has been cut in half. You will find two sheets linked below - a blank template and a demo file with some fake data added to provide context.

The system calculates student data automatically, both from data recorded with the STAR RTI screener and from teacher reporting. Data can be exported from STAR and easily added to the sheet. Then teachers add their own feedback - filling in services, behavior, attention to task, reading, math, and writing observations. The placement team organizes students into different classes for the upcoming year. Classes can be analyzed using different data points which can be changed dynamically using the controls all the way on the right of the class roster sheet sheet.

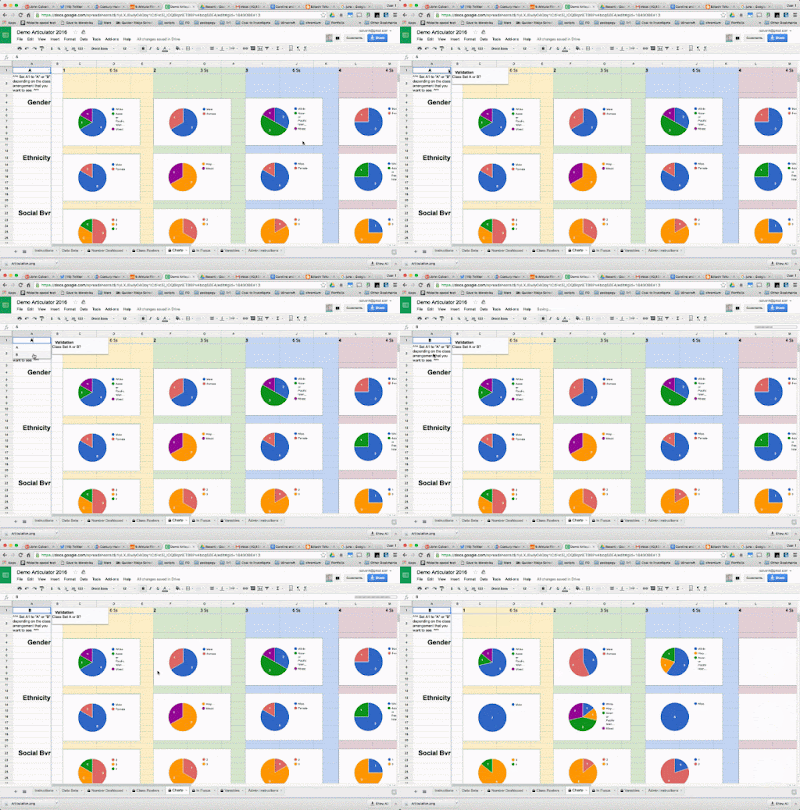
The system has several dashboards and can record two sets of placement, just in case a grade level is close to splitting or contracting. The dashboards include a class roster view, a chart view, an in focus page, and a numbers dashboard. We most often use the class roster and chart views during placement. The in-focus page can feed photos automatically, too, if you have a photo DVD from your photographer that uses student ID to name files.

I created an instructions page for administrators and teachers to help make this easier to set up and use. You can take a look at the posts written for the previous versions, too. They work in a similar way and some of the posts went into greater detail. Let me know if you try it. You can ask me questions or provide feedback here or on Twitter. Thanks!


Saturday, April 30, 2016

Student Placement with a Google Sheet

It’s that time of year when teachers thoughtfully build classes for next September. A while back I built a Google Sheet to help visualize the process with charts and graphs in real time. Each year I try to improve it based on the experiences from the previous year. I’ve tried to make the system easy for other schools to use, too, making most of the variables editable from a sheet. This post will introduce the 2016 articulator. Please note that all of the data used in this example is fake and was created using mockeroo.


How it Works
This system uses teacher feedback and optional data from the STAR RTI screener to create a series of visual dashboards. Each dashboard (numbers, roster, charts, and focus) works in real time to balance student placement when creating next year’s classes. There is some setup required, but I’ve worked hard to make it easier. You can follow the written directions for administrators here.


Teacher Input
Once a grade level is prepared, teachers add scores for student behavior and academics. Then teachers fill in any special services that are being delivered and add any other pertinent notes. As per last year’s feedback, behavior has been split into a social and an “attention to task” component. Manual categories for ELA and Math have also made a return, being left out in lieu of STAR data last year. Teachers felt that the STAR scores were not adequate alone. Fortunately, this makes the system more adaptable to schools who don’t use STAR. I’ve included directions for classroom teachers here.


Student Placement
My teachers often complete an initial placement before our first official meeting by changing the class number in the first column of the Data Beta sheet. Column B can be used If it is believed that a class might split or contract. The number of classes available in each set can be adjusted from the variable sheet. Each of the Dashboard sheets can switch from class set A or B by using a drop down menu in the top left. This configurability allows you to see how the proposed classes look in each configuration. You adjust the classes using the A and B columns on the Data Beta sheet during your placement meeting and the dashboards update in real time. Because the sheet is shared with everyone involved in placement, many eyes can watch for issues. Typically we appoint one person to be the official "updater" to keep confusion down.


Student Photos
This year I added student photos to the “In Focus” sheet. This optional feature requires the photos to be named using your student ID numbers and uploaded to a web directory (For the example I use the attachments feature of a Google Site.) Then paste the URL of the web directory into cell J15 of the Variables sheet. Since different systems export student photos using different formats, make sure you select the appropriate file type in cell J14.

Hope it Works for You, too!
This system has been extremely helpful during our student placement meetings. I hope it can be useful to others, as well. I’ve tried to make the system customizable and extensible and I’ll happily answer any setup questions in the comments. Please contact me directly on Plus or Twitter if you need help making any significant modifications.

Sunday, May 31, 2015

Student Articulation Lessons Learned


We are halfway through our student articulation meetings using the new articulator sheet that uses imported data from the STAR RTI screener. Some elements are going well. Being able to change the data visualizations using drop down menus has been amazing. The graphs and charts are hugely useful. The new system is less subjective, more visual, and has cut our articulation meetings down by a third. There are also several things that need to be made better for next year. This post will serve as a reflection that will hopefully inform (remind) my 2016 revision.


Behavior
Behavior is a subjective measure, but one that is crucial to consider for creating balanced classes. The system currently uses one metric for behavior. As we discuss students it is clear that this isn’t dimensional enough. Next year the system will include a metric for Social Skills and another for Attention to Task. These are both under the umbrella of behavior but mean something different for the chemistry of a classroom.


Link ALL Data to Student ID
Student information (Name, Birthday, gender, ethnicity, ect.) is currently pulled from the STAR reading data. The thinking behind this was ease of use: only two data imports were necessary (math and reading) to articulate the whole school and vertical lookups handle data using the student ID number after that. My method is flawed. Teachers use the “Data Beta” sheet to perform the initial placement and to add subjective scores like behavior and notes. The teacher added information is purely positional to the STAR data. In other words, student X is on row 4, and the teacher added data is also on row 4. The teacher added information will no longer match up to the right students if anything happens to the sort or row placement on the reading sheet. In the next iteration I need to have teachers add their information directly to the STAR reading sheet or a third data sheet that is only student demographics. The teacher added information needs to be anchored to the student ID number. This was lazy thinking on my part. It hasn’t been an issue (except for the next paragraph) because I’ve been careful, but it makes me nervous and is just sloppy.


Cross-Browser Inconsistency
I've discovered that the sheet sorts differently when teachers use a different browser. This was quite a surprise. The all of the data is brought to the “Data Beta” sheet via Queries. I have to test this more and haven’t realized the exact reason, but it is clear that the students sort differently when the sheet is accessed with Firefox or Safari. This is an issue because of the previous paragraph. I've told my teachers to only use Chrome when working with the articulation sheet which avoids any trouble. If I effectively anchor everything using the Student ID this won’t be an issue at all.

The process has been going really well and the sheet has been working. A few things have made the process clunkier than I’d like. Ironically, the biggest issue (not hard linking the teacher added information to Student IDs) was intended to make the setup easier. It was a “penny-wise and pound-foolish” decision. Even so, placement is going better than ever and the issues I've discussed here are fixable. The next iteration will be even better.

Tuesday, April 7, 2015

Student Articulation Using STAR Data and Google Sheets


It’s the time of year when we start to think about placing our elementary students into next year's classes. This project uses data from the Renaissance Learning STAR RTI screener to help build balanced classes using configurable and visual dashboards. If you use STAR assessments then this project is for you!
The project has a data loader where you can add the math and reading assessment sheets that are exported directly from STAR. You can customize the number of students in your school, the teachers, and the grade level that you are articulating on the “Variables” sheet. This demo has been loaded with fake data, created using Mockaroo (I love that site!)
Once the student data is loaded, teachers can perform an initial placement of the students in their class. There is an option to place students in two different class arrangements, just in case a current grade is close to splitting or contracting. Once students have been initially placed, the articulation team can meet to refine the placement using the different data dashboards.


Each dashboard is configurable using drop down menus. The “Roster” dashboard lists students who are selected for each class and allows the articulation team to compare three metrics at the same time from a menu of twenty-four. The “Charts” dashboard shows a visual representation for each class and the “In Focus” dashboard details any one class, including the “Do not place with…” information. Each dashboard can instantly toggle between class configurations, just in case teachers need to plan for a potential split or contraction.
The project has an instructions page for teachers and administrators to help set up the system. It is definitely the best articulator yet, built from what was learned after using the previous iterations. I hope other systems, probably those that also use STAR assessments, find this useful. If you are able to use this project, let me know in the comments!

Sunday, April 27, 2014

Elementary Student Placement Calculated with Google Sheets


Right around now, elementary schools everywhere are beginning to discuss student placement for next year. It can be a time consuming process, with lots of meetings loaded with multi-colored index cards and post it notes. In an effort to make the process easier last year, I created a Google Sheet to help teachers visualize balanced classrooms. This year I improved the system based on lessons learned.


The sheet is shared with teachers after student demographic information is added to the "data" tab.  Teachers complete the sheet with academic and anecdotal information. Then, teachers organize an initial placement of their class. Because of Google’s Sheet collaborative capabilities, this is all done before the first meeting.


When the grade level teachers do meet, they already have a starting place because of the initial placement. The “Dashboard” sheet provides a quantitative look at how the classes are balanced by automatically calculating all of the information, including gender, academics and behavior. Students are moved from one class to another on the "Data" sheet to rebalance the numbers.


The "Class Roster" sheet allows the placement team to see the classes by name.  It’s possible to customize the data shown in each column by using the drop down menus on the right side of the roster.


I’ve included directions for the administrators who are setting up the sheet and for the teachers who are placing their students. Last year we were able to reclaim one whole day from the process. I hope others find this useful as well. Please let me know if you use it and if you have any ideas to make it better.

*All data used in the example is fictional for demo purposes.