Sunday, October 14, 2018

Google Sheets Powered PO Generator


Writing purchase orders is one of the least favorite parts of my job. It’s often a repetitive and monotonous task that requires a deep dive into a file cabinet, a massive catalog, or both. I created this spreadsheet tool to make POs a little less onerous. This system keeps track of your orders, allows you to take notes, monitors your budget in different budget codes, and will actually generate the printed PO sheet! Make a copy if you would like to use the sheet. I hope you find this as useful as I do.

Setting up the sheet is easy. Just add your vendor information to the Vendor Tab. As a general rule, anything in the sheet with a yellow background can be edited. Anything with a grey or black should not be edited. These are controlled with functions. Adding vendor addresses is a one-time outlay of work. The address will auto-fill on the POs. I include my own information here, too, because there are certainly times when I purchase something from a vendor not on the bid list (Amazon, anyone?) and need to submit a PO with me as the vendor. You can add vendors as you need them, secure in the knowledge that the address will be ready the next time a PO is generated for that seller.

Also on the Vendor sheet is a budget code table. I have two budget codes as a technology teacher, one for supplies and another for equipment. In order to keep track of your codes, add the total amount you have to spend and the codes themselves in the appropriate columns (yellow only.) You’ll notice that the sheet automatically keeps track of the amount left in each budget code and the supplies code has a function that helps me keep track of per student expenditure.

The “Master Sheet” is where I fill out my orders (yellow cells only.) It's fairly self explanatory. One this thing I need to point out: the first two columns seem redundant but are not! The first column allows me to specify an order on a specific day, the second column is only the vendor name, linked to your vendor sheet. This second column controls the address information and is independent of the date. Both are necessary!

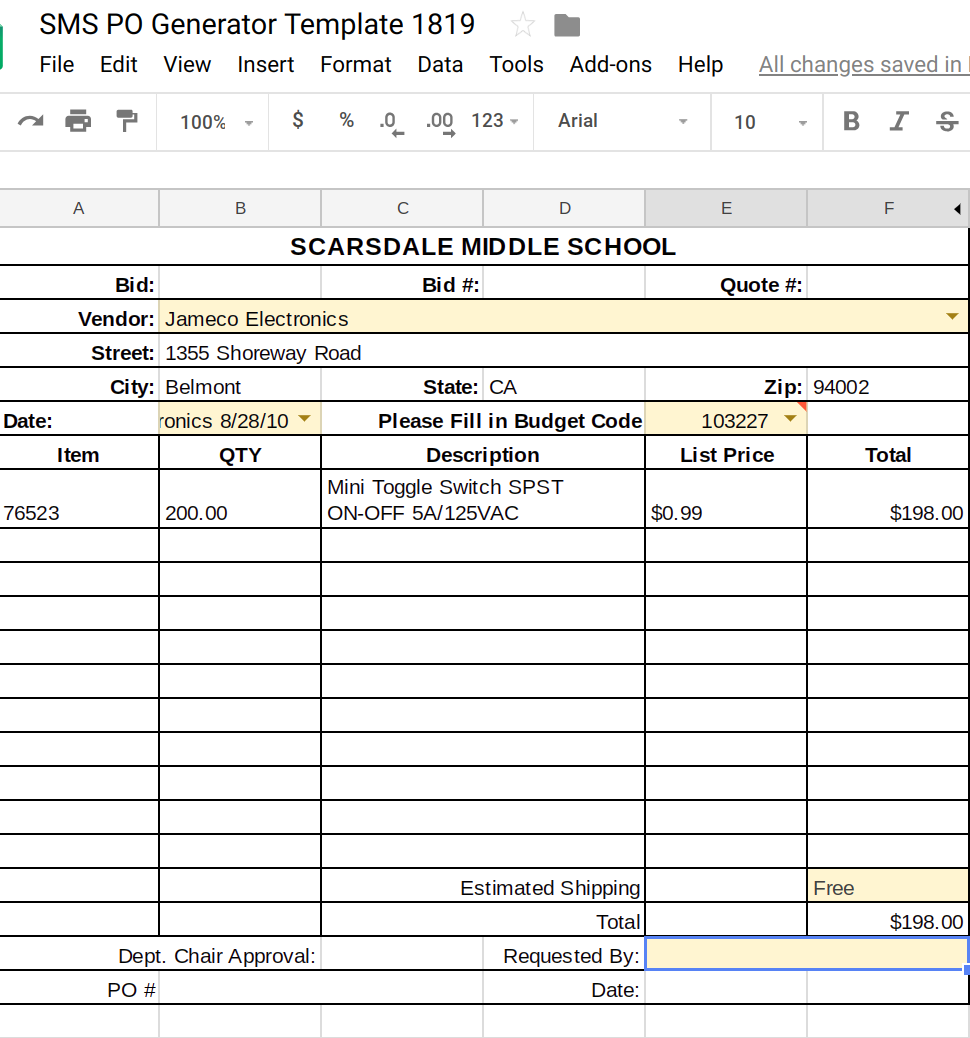
Once your order is recorded on the “Master Sheet” you can generate your PO. Now you have one place for all your PO records and you don’t have to worry about handwriting a PO form. Better yet, next year I have a clear record and can reorder easily. Open the PO Generator tab. You will notice four yellow cells, three with drop down boxes. Select your Vendor, which will populate all of the address fields. Then, select the date the PO was written, which is fed from the first column of the “Master Sheet.” Finally, select the budget code, write in the potential shipping cost, and add your name in the “Requested by:” field.

Your PO Is ready to print! This has made PO writing so much easier for me. I keep notes on my Master Sheet, such as when an order arrives, or if I was unhappy with the product. My record keeping is better and the process is a lot faster. This was designed using the Scarsdale PO form, so you may need to redesign the PO Generator layout. Let me know if you use this and if you’ve made it better!


Saturday, September 15, 2018

Infographic University


Our students publish their first infographics in second grade, and then cycle back in fifth with an Infographic designed for a state research project. These graphics expect more. Students are taught more about graphic design and how to visualize data in an engaging way. The trick is teaching students how to use the design tool, in this case Google Drawings, at the same time. Inspired by the design tutorials provided by Canva, Infographic University was born.

It must be noted that this is a culminating activity to a research unit. Students study one of the states and use this graphic organizer to record and organize their research. Students decide on the best information to share on their graphics. This is a critical step to the success of the project. Garbage in, garbage out, right?

Infographic University is a self-paced introduction to infographic design, but it starts with explicit instruction. On day one students are shown examples of infographics and then complete this graphic organizer in small groups to identify the use of color, fonts, visuals, and organization. These noticings are discussed as a class.


On day two, the university files are introduced. Infographic University has four self-paced files, numbered in the order that students will complete them. A copy of the files must be made for each student so that they can edit them. I would introduce how the files work, modeling how you use the zoom tool in Drawings to get very close and read the directions. Then, show how you can move around the file using two finger swipes or by zooming out and zooming back in. These are good strategies to be familiar with when they start designing their own graphic.

Each University file is broken down into lessons. Lessons introduce an idea, such as using negative space, then ask students to practice the idea. Each lesson includes step by step directions in the margins of the Drawing file - but the design choices are up to the student. The teacher can review the files to see if the concept was understood successfully. Students have created infographics on making infographics when they’ve finished Infographic University.

The infographic template is copied for the student when the four university files are completed. I’ve found that students need another lesson of direct instruction on how to use the template, but then they are off to the races. Using the resources in the margins, a color pallet is selected (one of the skills practiced in the University) and students select the layouts for each section. Some graphics that are helpful for representing data are also available in the margin.


When the graphic is complete, students link their research graphic organizer as the source file at the bottom. The margin also includes a checklist, requiring students to reflect on the design principles practiced in the University files.  I think this approach worked really well. Students were give a good blend of autonomy and structure in order to be successful and still think critically. Let me know if you use any of these files, I’d love to hear about your experience. More importantly, let me know if you’ve improved them!